For Managing Directors, CEOs, and Sales Directors, gaining clear visibility into overall sales performance can be a challenge. With sales teams handling numerous deals, leads, and interactions, it is crucial to have an efficient way to track key metrics and ensure informed decision making. This is where Customer Relationship Management (CRM) dashboards come into play.
A well-designed CRM dashboard provides a comprehensive, real-time view of sales performance, helping business leaders make strategic decisions that drive revenue growth and improve profitability. By leveraging CRM platforms such as Microsoft Dynamics 365 Sales and SuperOffice CRM, companies can enhance their ability to monitor sales pipelines, forecast revenue, and track team productivity, all from a single, intuitive interface.
The Importance of Real-Time Sales Insights
In today’s fast-paced business environment, delayed or incomplete sales data can lead to missed opportunities, poor forecasting, and ineffective strategic decisions. A CRM dashboard solves these issues by offering:
- Real-time data visualisation: Ensuring business leaders have the latest information at their fingertips.
- Key performance indicators (KPIs) tracking: Allowing management to assess sales success against business objectives.
- Team productivity monitoring: Providing insights into how sales representatives are performing and where improvements are needed.
- Improved sales forecasting: Helping leaders anticipate revenue trends and allocate resources effectively.
- Data-driven decision-making: Supporting informed choices that enhance business growth and profitability.
Let’s explore how two leading CRM solutions, Microsoft Dynamics 365 Sales and SuperOffice CRM, help businesses achieve these benefits through their powerful dashboard capabilities.
Microsoft Dynamics 365 Sales: Advanced Dashboards for Data-Driven Decision-Making
Microsoft Dynamics 365 Sales is a comprehensive CRM solution designed to streamline sales processes, enhance customer relationships, and boost revenue growth. One of its standout features is its advanced dashboard functionality, which provides real-time insights into sales performance.
Features and Benefits of Dynamics 365 Sales Dashboards:
- Customisable dashboards: Users can tailor dashboards to display key sales metrics, such as revenue forecasts, pipeline health, and deal status.
- AI-driven insights: Predictive analytics help identify high-value opportunities and potential risks within the sales funnel.
- Interactive visualisations: Graphs, charts, and reports make complex sales data easy to interpret.
- Seamless integration with Microsoft tools: Works seamlessly with Power BI, Excel, and Microsoft Teams for enhanced collaboration and reporting.
- Mobile accessibility: Ensures that sales leaders can access vital data from anywhere, improving responsiveness and agility.
These dashboards empower business leaders to make strategic decisions based on real-time data, improving overall sales performance and profitability.
Some Examples of Microsoft Dynamics Sales Dashboards
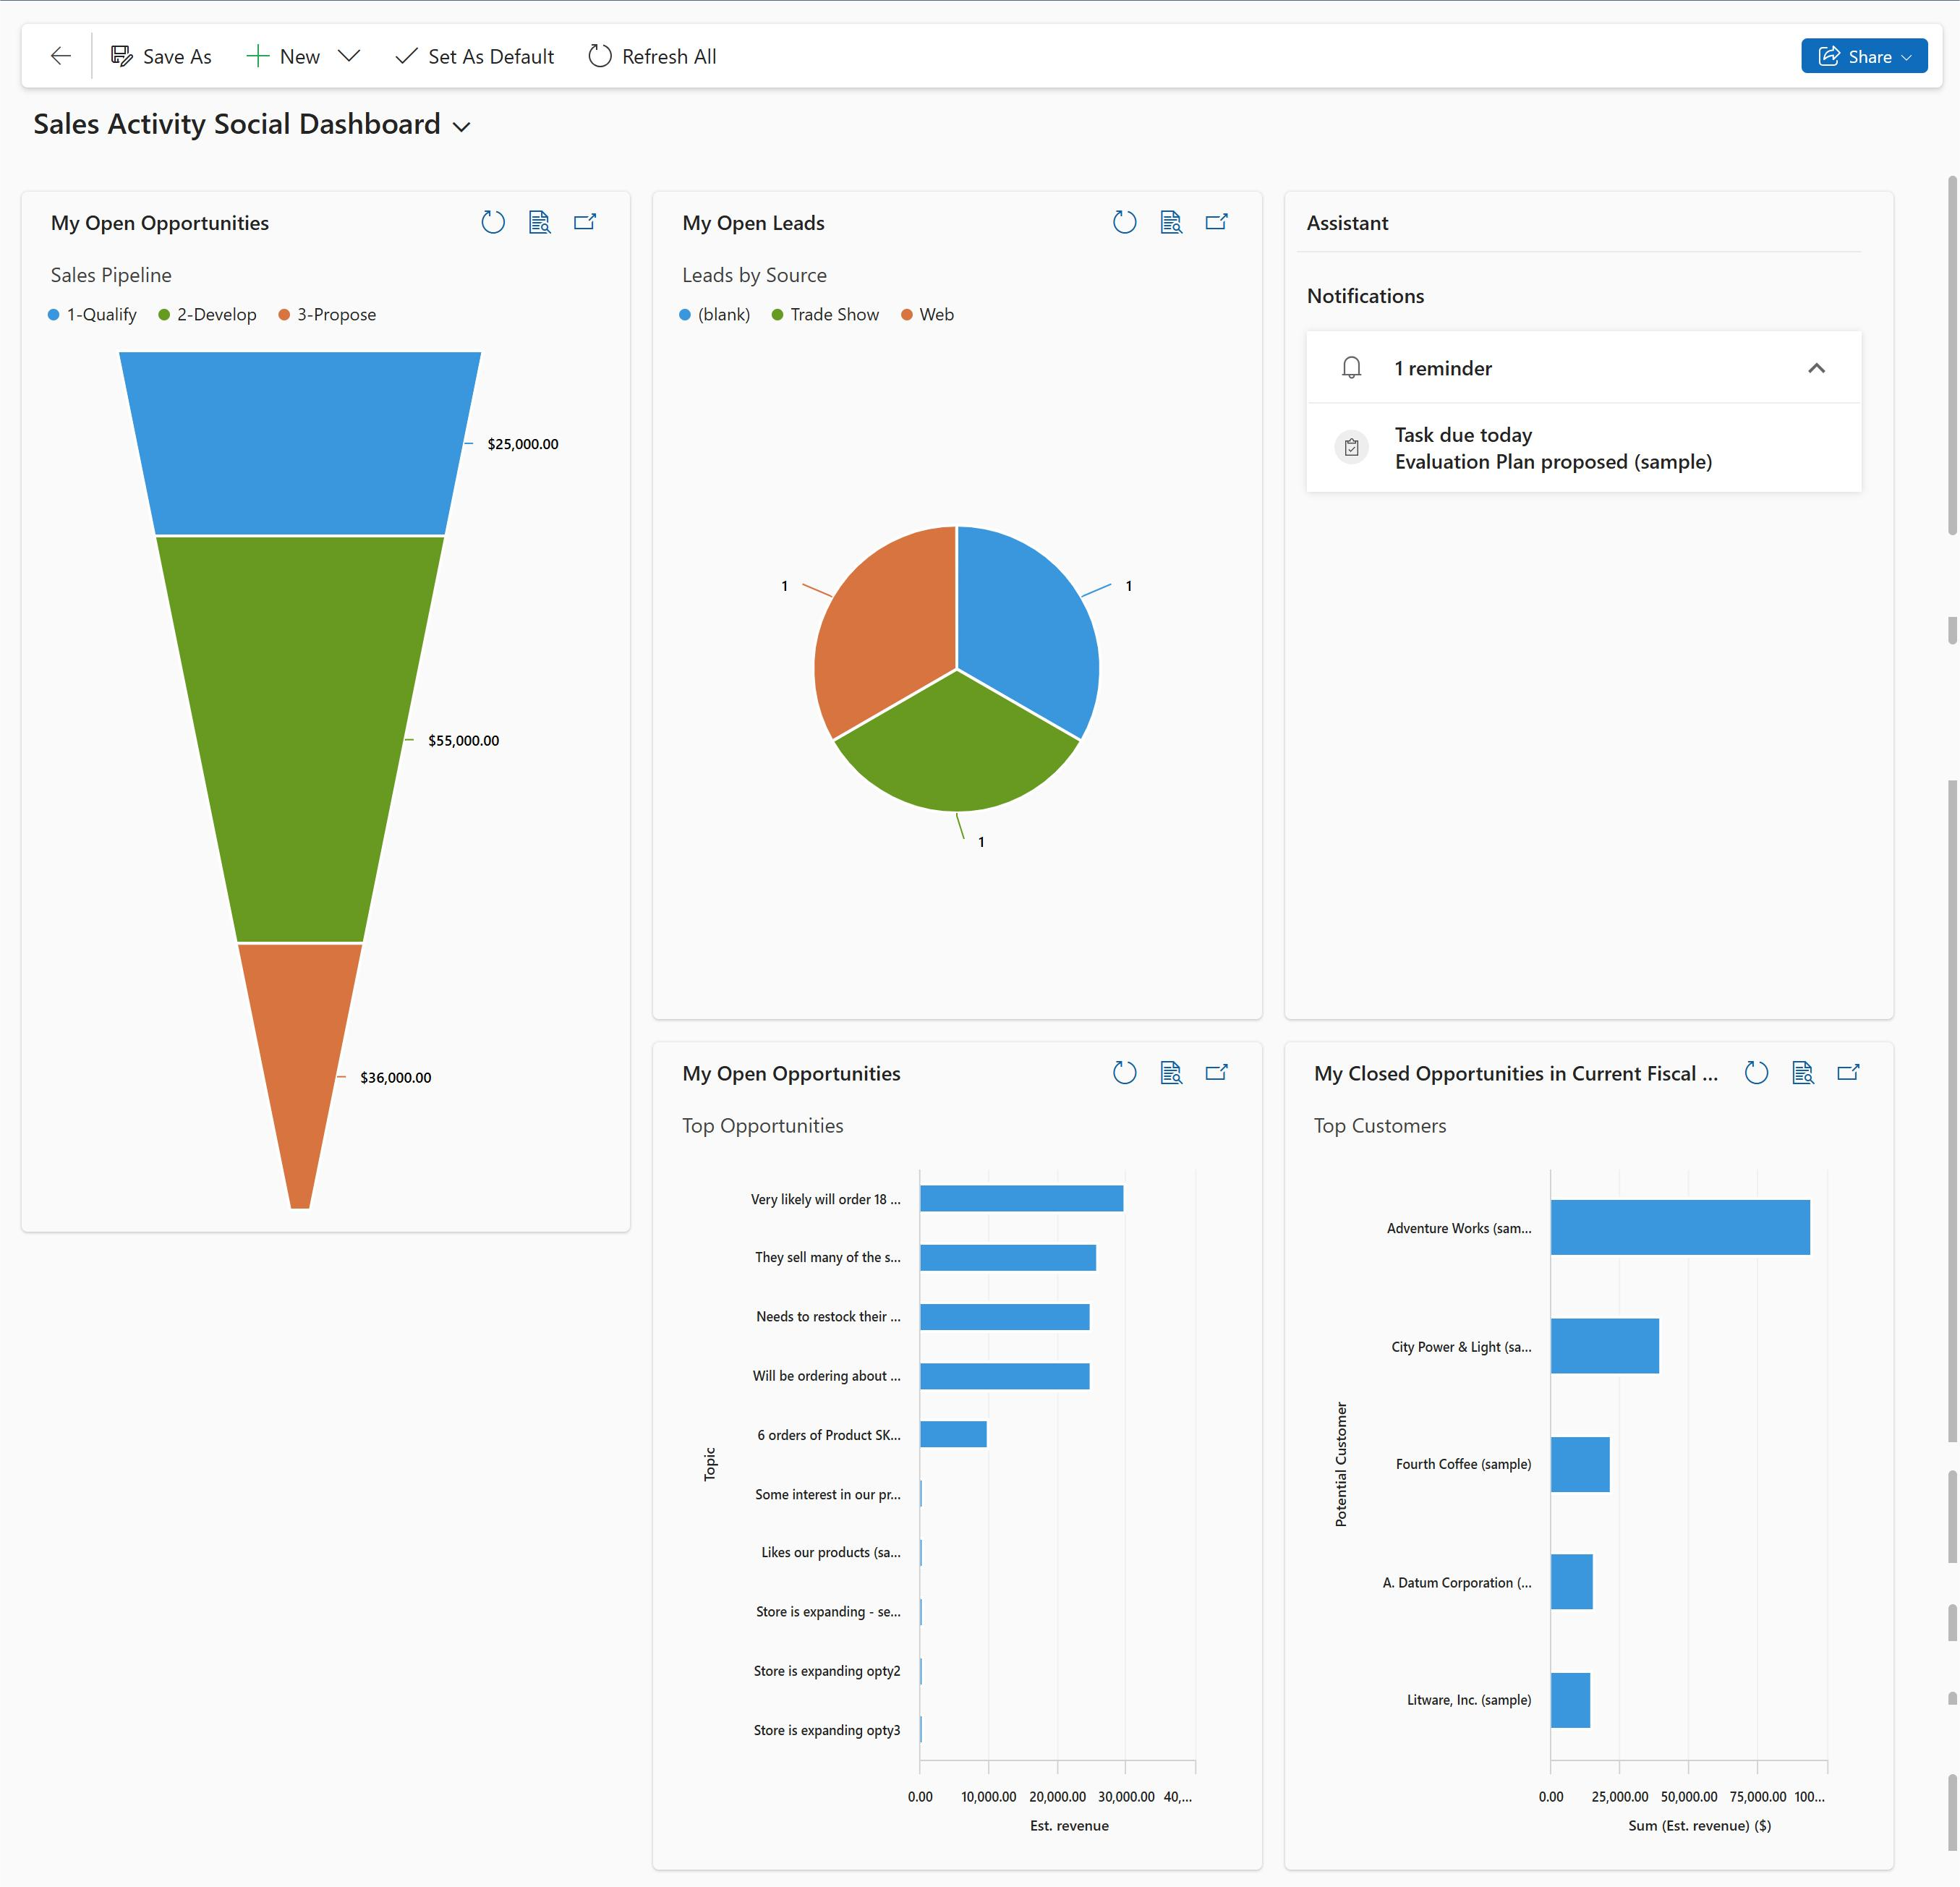
Sales Manager Summary dashboard
This dashboard shows data that helps sales managers get important insights on how their sales team is doing. The sales pipeline shows open opportunities in different stages.
The Deals Won vs. Deals Lost chart shows the number of opportunities won or lost by an owner. The dashboard also includes charts that show important financial data, such as estimated versus actual revenue by month.
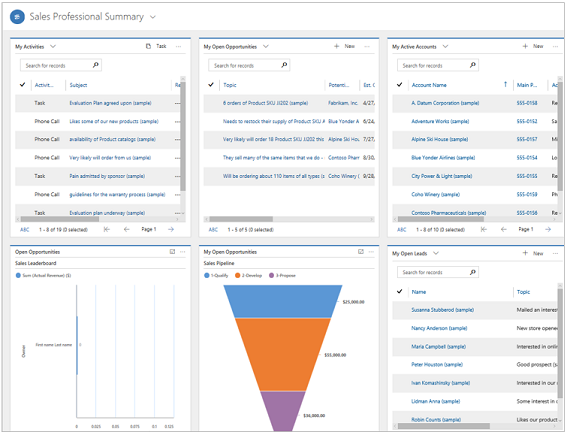
Sales Professional Summary Dashboard
This dashboard shows daily work-related sales numbers, such as the activities you’re working on, your sales pipeline, and your open opportunities and leads.
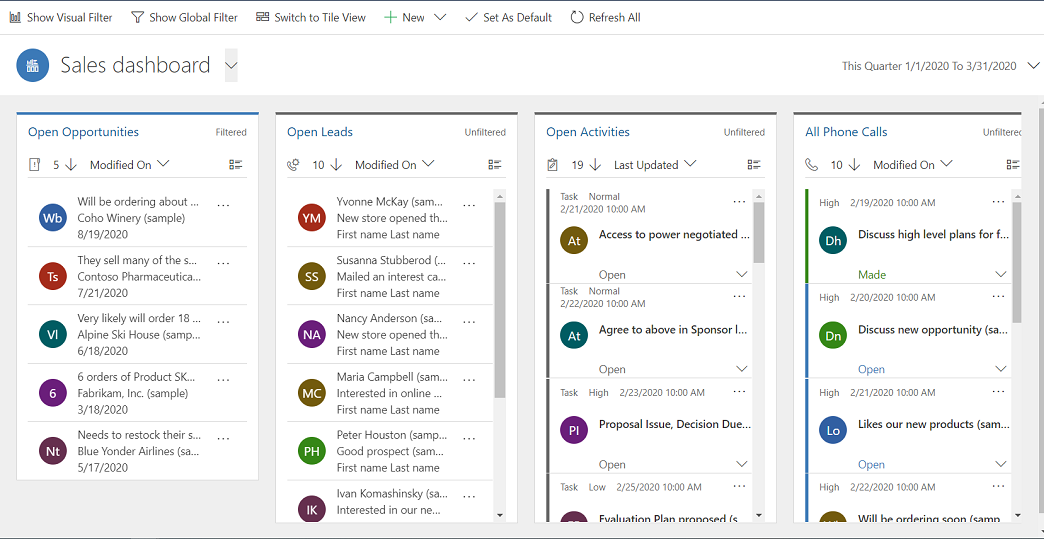
Sales Dashboard
The interactive Sales dashboard helps you review information from various entities and act on it. You can use visual and global filters in the dashboard to quickly get to what’s most important.
The Sales dashboard is a multi-stream dashboard, where each stream shows a view of an entity.
You can find out more about Microsoft Dynamics 365 Sales Dashboards here: Gain insights with dashboards | Microsoft Learn.
SuperOffice CRM: Intuitive Dashboards for Sales Performance Visibility
SuperOffice CRM is another powerful CRM platform designed for businesses that require a user-friendly and flexible solution to manage their sales operations. It offers a streamlined approach to sales tracking, helping organisations gain complete visibility into their sales pipeline and team performance.
Features and Benefits of SuperOffice CRM Dashboards:
- User-friendly interface: Simple and intuitive design makes it easy to navigate and extract meaningful insights.
- Real-time sales tracking: Allows business leaders to monitor ongoing sales activities and progress toward targets.
- Integrated reporting tools: Provides built-in reports for pipeline analysis, sales forecasting, and team productivity assessment.
- Automated workflows: Helps streamline repetitive sales tasks, improving efficiency and focus on high-value activities.
- Cloud-based access: Ensures that users can view dashboards and reports from any location, supporting remote sales teams.
SuperOffice CRM’s dashboards allow businesses to make informed, data-driven decisions that enhance sales effectiveness and profitability.
Some Examples of Dashboards in SuperOffice CRM
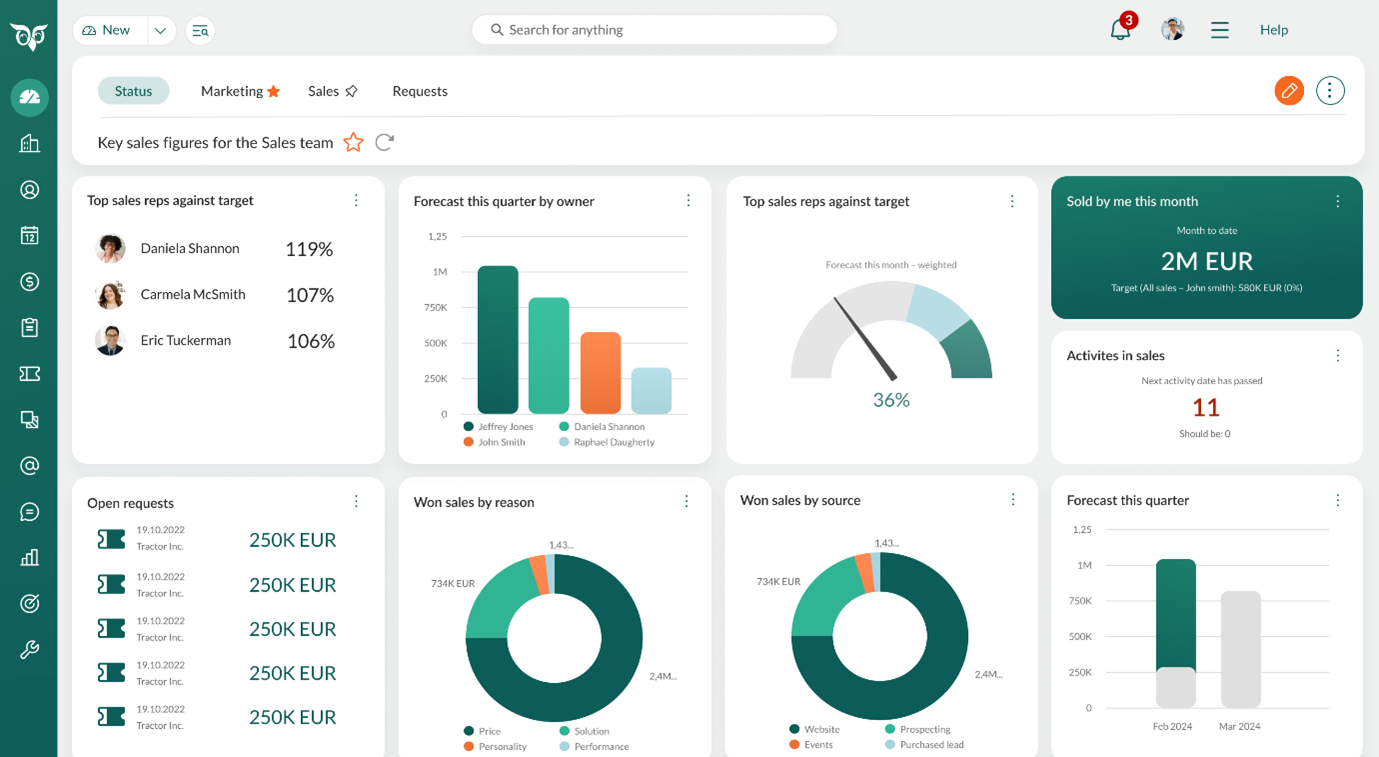
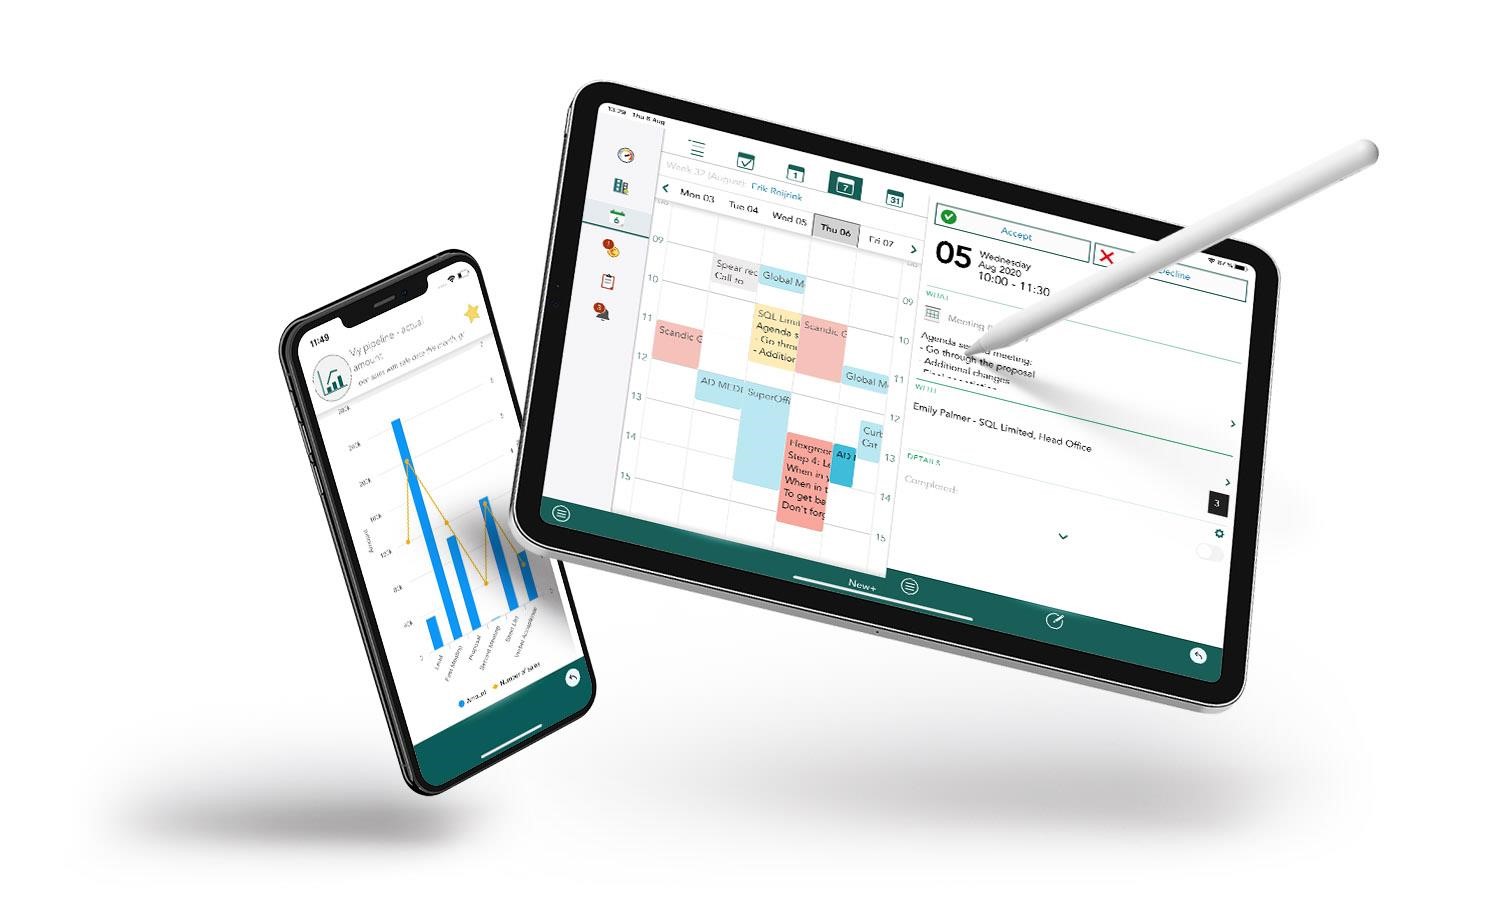
SuperOffice CRM offers a variety of dashboards that provide insights into different aspects of sales and customer management. Each of the “dashboards below, are really individual tiles, and can be arranged together onto a single dashboard, like the one above. This dashboard shows the New SuperOffice UI. You can read more about that here: SuperOffice Launches New User Interface and AI Features – Synergy Technology
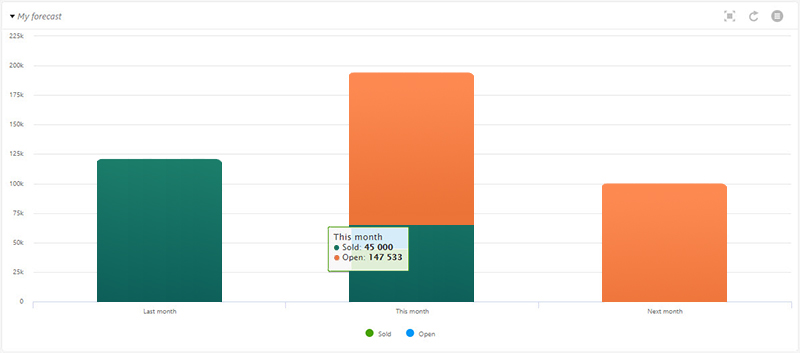
The “forecast” dashboard
The forecast dashboard will show you the following sales numbers:
- How much you sold last month;
- How much you’ve already sold this month;
- How many open sales opportunities you still have available;
- How many open sales opportunities you have to work with next month.
The total amount of open sales will show you whether or not you will reach your budget this month.
This type of dashboard also shows you the total value of the leads you will be able to work with next month. You can see the exact number of leads and the total value of these opportunities.
It is a great indicator that will tell you whether you can focus on closing or whether you should focus on finding more prospects.
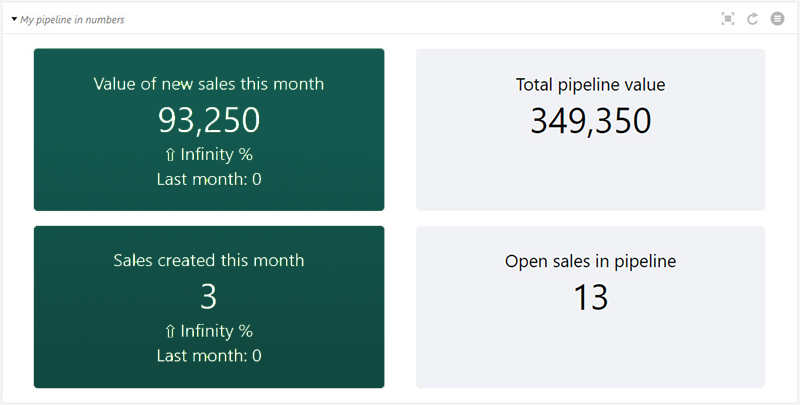
The “pipeline in numbers” dashboard
The “pipeline in numbers” dashboard shows you the speed of your sales pipeline: which is demonstrated by the total value of the sales currently in your pipeline. You only need one look at this number to know whether it’s high enough to reach your sales budget for this month.
This dashboard will also inform you about the number of new sales opportunities you have created this month and what their combined value is.
By regularly checking these numbers you can make sure you have added enough qualified leads to fill up your pipeline for this month and the months to come.
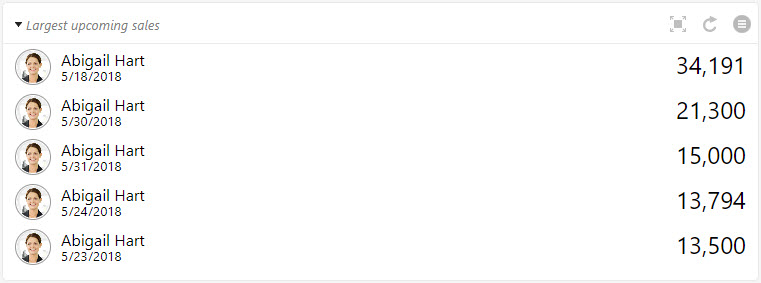
The “largest upcoming sales” dashboard
This dashboard will give you a list of the five biggest sales opportunities in your pipeline. The list is ranked by the size of sales and it tells you when you expect your customer to make their final decision.
This way, you will know exactly which deals you should prioritise.
From the list with the largest upcoming sales, you can go directly to your priority sale and see which follow-up activities you have planned and whether you have sent the customer a sales proposal or not, for example.
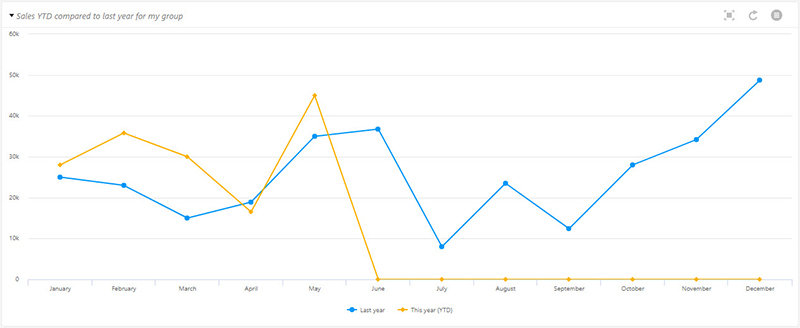
The “YTD comparison” dashboard
Working as a sales rep is one of the most competitive jobs there is. Not only do you try to beat your competitors, but you also need to outperform your colleagues. And most importantly: you are always competing against yourself.
The year to date (YTD) comparison dashboard will help you keep track of your progress month after month. This dashboard allows you to see how well you are performing against last year’s sales numbers.
By keeping the yellow line (this year’s sales numbers) above the blue line (last year’s sales numbers) as often as you can, you are sure to be among the top sellers in your team.
Using sales dashboards on your mobile
With Pocket CRM, the SuperOffice CRM mobile app, you can check the status of your pipeline or your current activity level directly on your mobile device, anywhere and at anytime. This way you will be able to stay in control of your sales 24/7.
Microsoft Power BI Dashboards
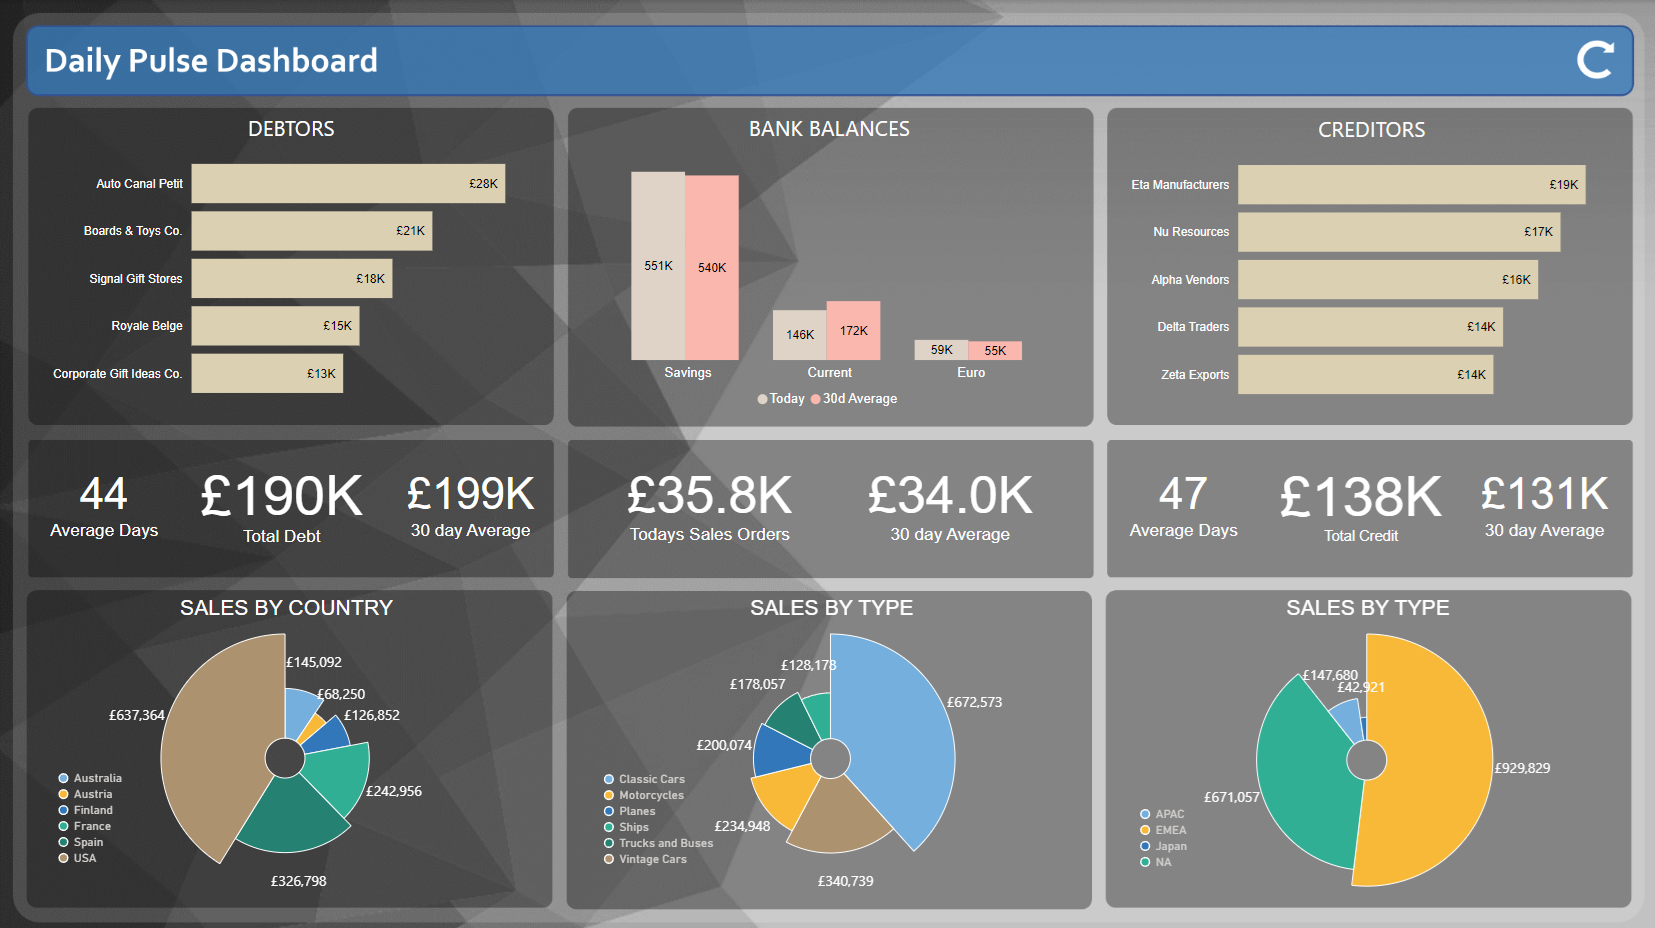
Microsoft Power BI is a powerful tool for creating interactive and insightful dashboards from various systems. It allows businesses to consolidate data from multiple sources, including CRM systems like Microsoft Dynamics 365 Sales or SuperOffice, as well ERP and accounting solutions such as Microsoft Dynamics 365 Business Central, or Pegasus Opera, into a single, unified view. This integration capability enables organisations to analyse customer data comprehensively, uncovering trends, patterns, and insights that drive informed decision-making.
Power BI’s user-friendly interface and robust features make it easy to design custom dashboards tailored to specific business needs. Users can create visualisations, reports, and charts that highlight key performance indicators (KPIs), sales metrics, customer behaviour and other critical data points. The ability to drill down into data, apply filters, and use AI-driven analytics further enhances the depth of insights that can be derived from CRM data.
Synergy Technology has expertise in using Power BI to design and build bespoke dashboards that meet the exact expectations of their customers. With a team of experienced data analysts and developers, Synergy Technology ensures that each dashboard is meticulously crafted to align with the unique requirements of the business. We work closely with clients to understand their goals, challenges, and data sources, ensuring that the final product is both functional and visually appealing.
How Synergy Technology Helps Businesses Implement the Right CRM Solution
Selecting and implementing the right CRM system is not a one-size-fits-all process. Each business has unique requirements, and a solution that works well for one company may not be the best fit for another. This is where Synergy Technology comes in.
Why Choose Synergy Technology?
- Unbiased CRM recommendations: Unlike providers that only offer a single CRM solution, we work with multiple platforms, including Microsoft Dynamics 365 Sales and SuperOffice CRM. This enables us to recommend the system that best suits each business’s needs.
- In-house development expertise: Our team of developers customises CRM software to fit specific business requirements, ensuring that companies get the most value from their solution.
- Integration with third-party applications: We help businesses extend the functionality of their CRM by integrating it with accounting, marketing automation, and other essential business tools.
- Ongoing support and training: We provide comprehensive support to ensure that businesses fully leverage their CRM dashboards and reporting capabilities.
By working with Synergy Technology, businesses can confidently implement a CRM solution that provides actionable sales insights, enhances productivity, and ultimately drives profitability.
Real-World Success Stories
Many businesses have already benefited from Synergy Technology’s expertise in implementing Microsoft Dynamics 365 Sales and SuperOffice CRM. Some notable customer success stories include:
- Enhancing sales visibility for a growing enterprise: A company struggling with fragmented sales data adopted Microsoft Dynamics 365 Sales with Synergy Technology’s assistance. Custom dashboards provided real-time insights into sales performance, leading to improved forecasting and strategic decision-making.
- Boosting efficiency with SuperOffice CRM: A business experiencing bottlenecks in its sales process worked with Synergy Technology to implement SuperOffice CRM. Customised dashboards and automated workflows significantly improved team productivity and revenue growth.
For more customer stories, visit our customer success stories page.
Want more Information on Dashboards in CRM?
For business leaders, having real-time visibility into sales performance is crucial for making strategic decisions that drive growth and profitability. CRM dashboards in Microsoft Dynamics 365 Sales and SuperOffice CRM provide the insights needed to monitor KPIs, track sales progress, and improve team efficiency.
At Synergy Technology, we help businesses implement, customise, and integrate the right CRM solution tailored to their unique needs. Whether it’s Microsoft Dynamics 365 Sales, SuperOffice CRM, or another solution, we ensure that our clients receive a system that maximises their sales potential.
If your business is struggling to gain a clear view of sales performance, contact Synergy Technology today to discover how a tailored CRM solution can transform your operations and drive success.
For more information on how Synergy Technology can help your business grow, call us on 0345456 0050 or send us a message through our contact page.
Follow us on social media:

